TOP FLIGHT INFO
PORTFOLIO PERFORMANCE
It is important to evaluate the prior performance of any investment advisor before you invest with them. While past performance does not guarantee future results, at least it does give you an idea on whether or not the advisor you are considering has succeeded in the past.
This may seem obvious, but surprisingly, most advisors do not make their track record available for review. In addition, some advisors post hypothetical track records that show what might have happened if you invested a certain way, not what actually did happen. Finally, the few advisors who do their results often show gross returns rather than net returns. This type of reporting shows higher returns than what their clients actually received. This is why it is important to review and scrutinize the track record of any advisor you are considering.
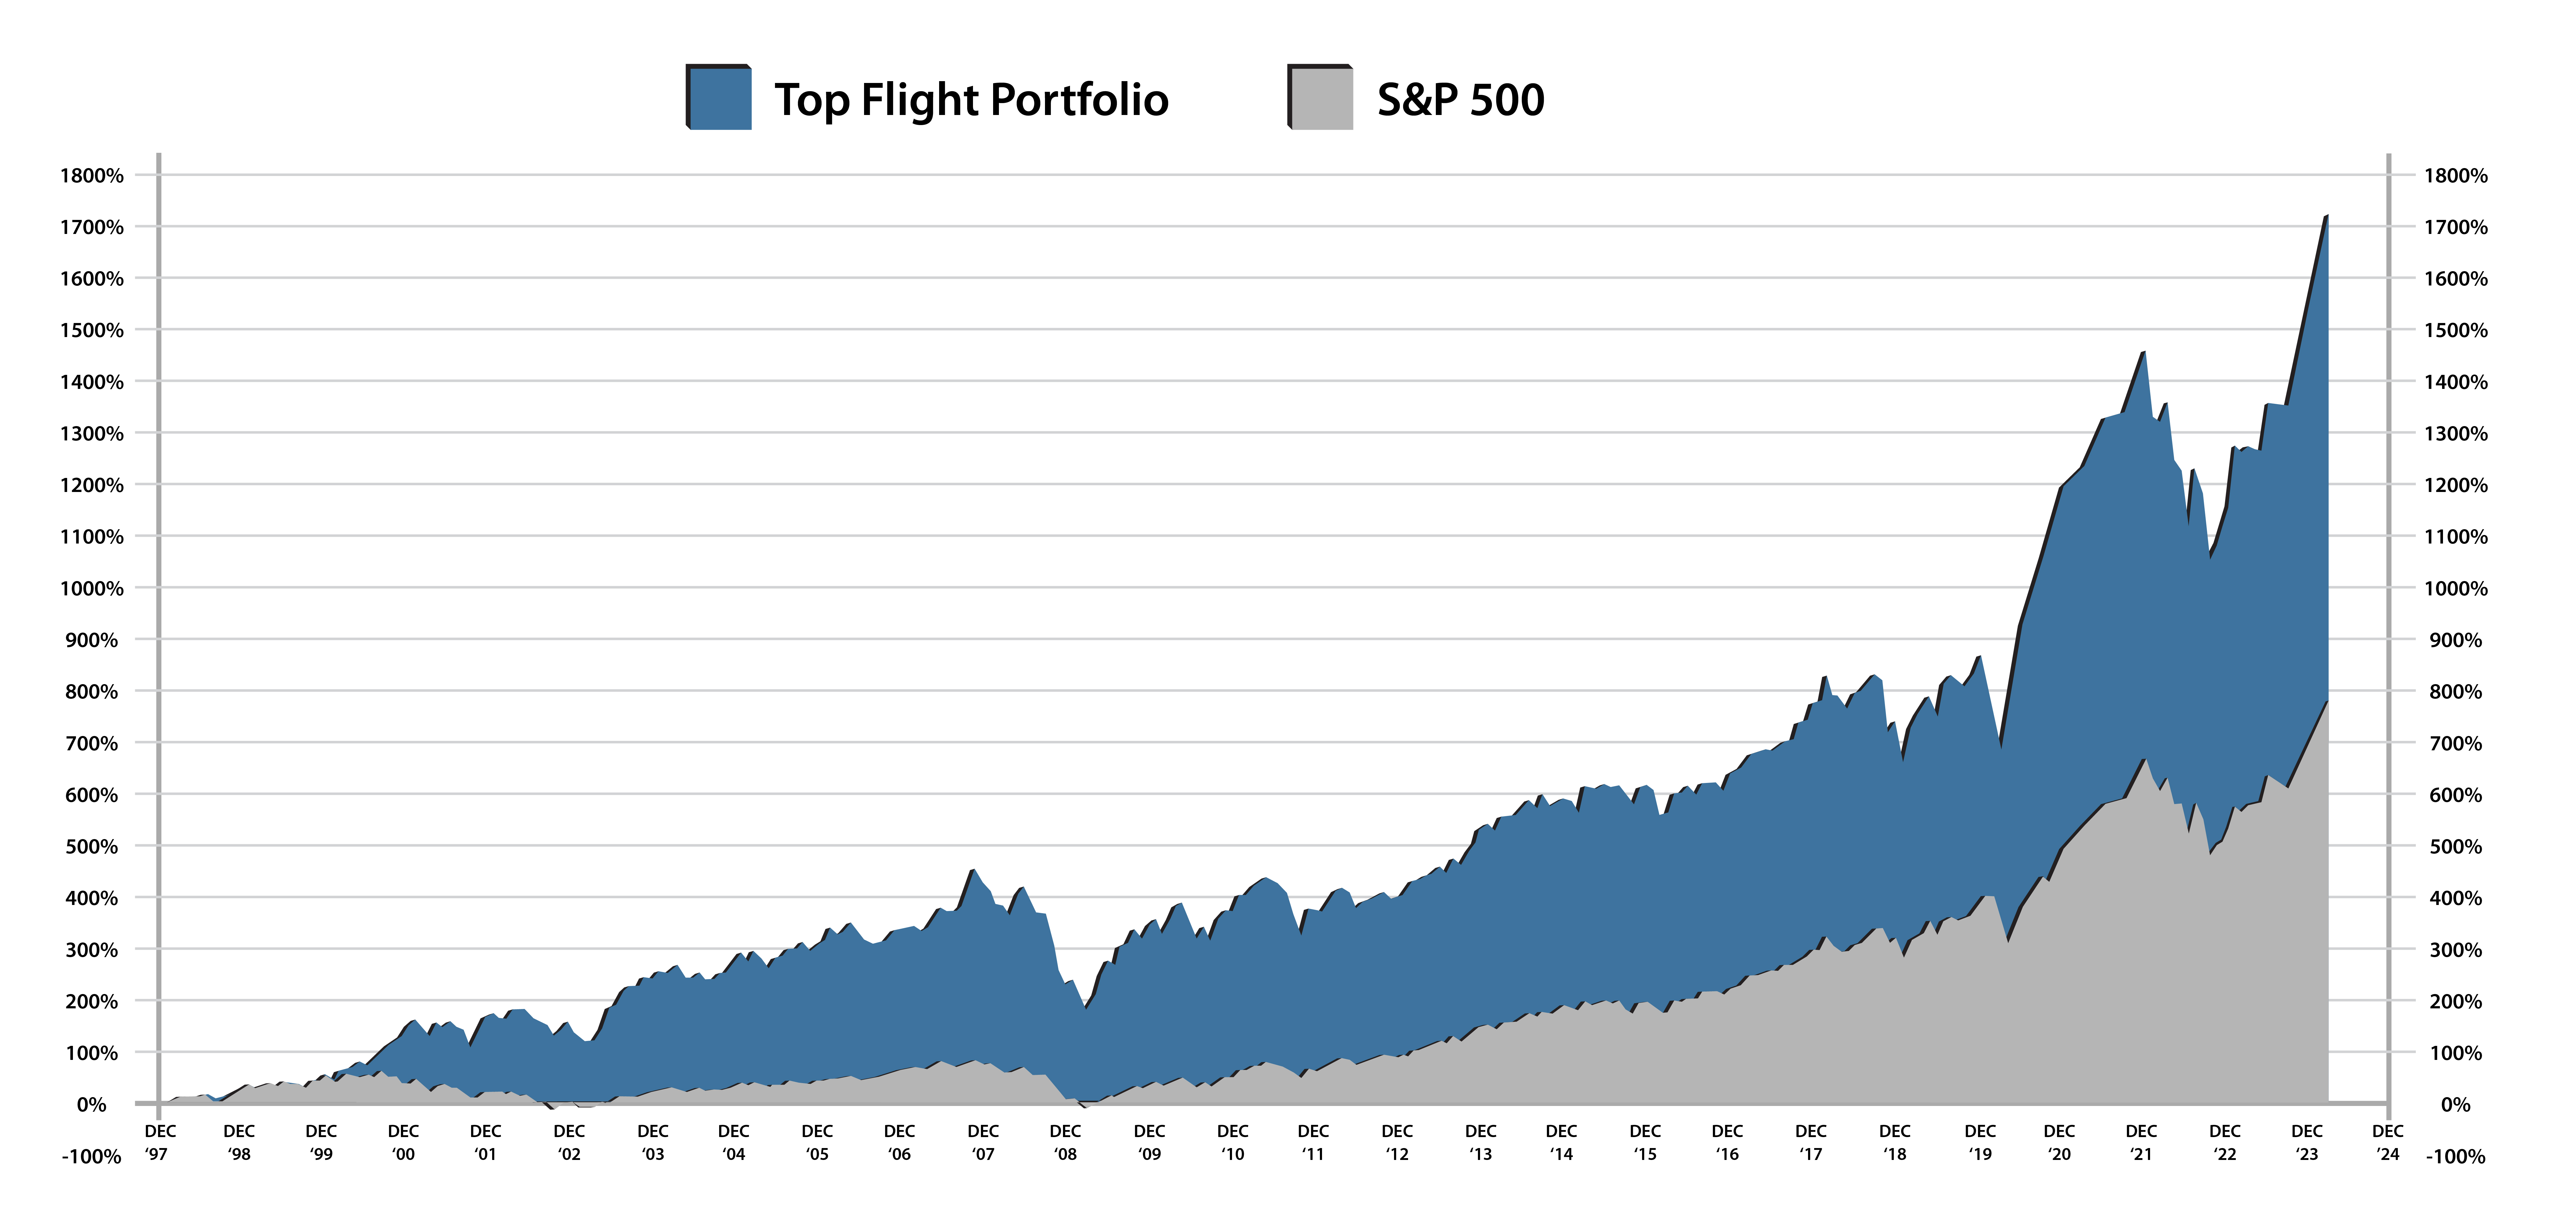
Paragon shows the actual, net returns that their clients received. Those returns are shown in chart.
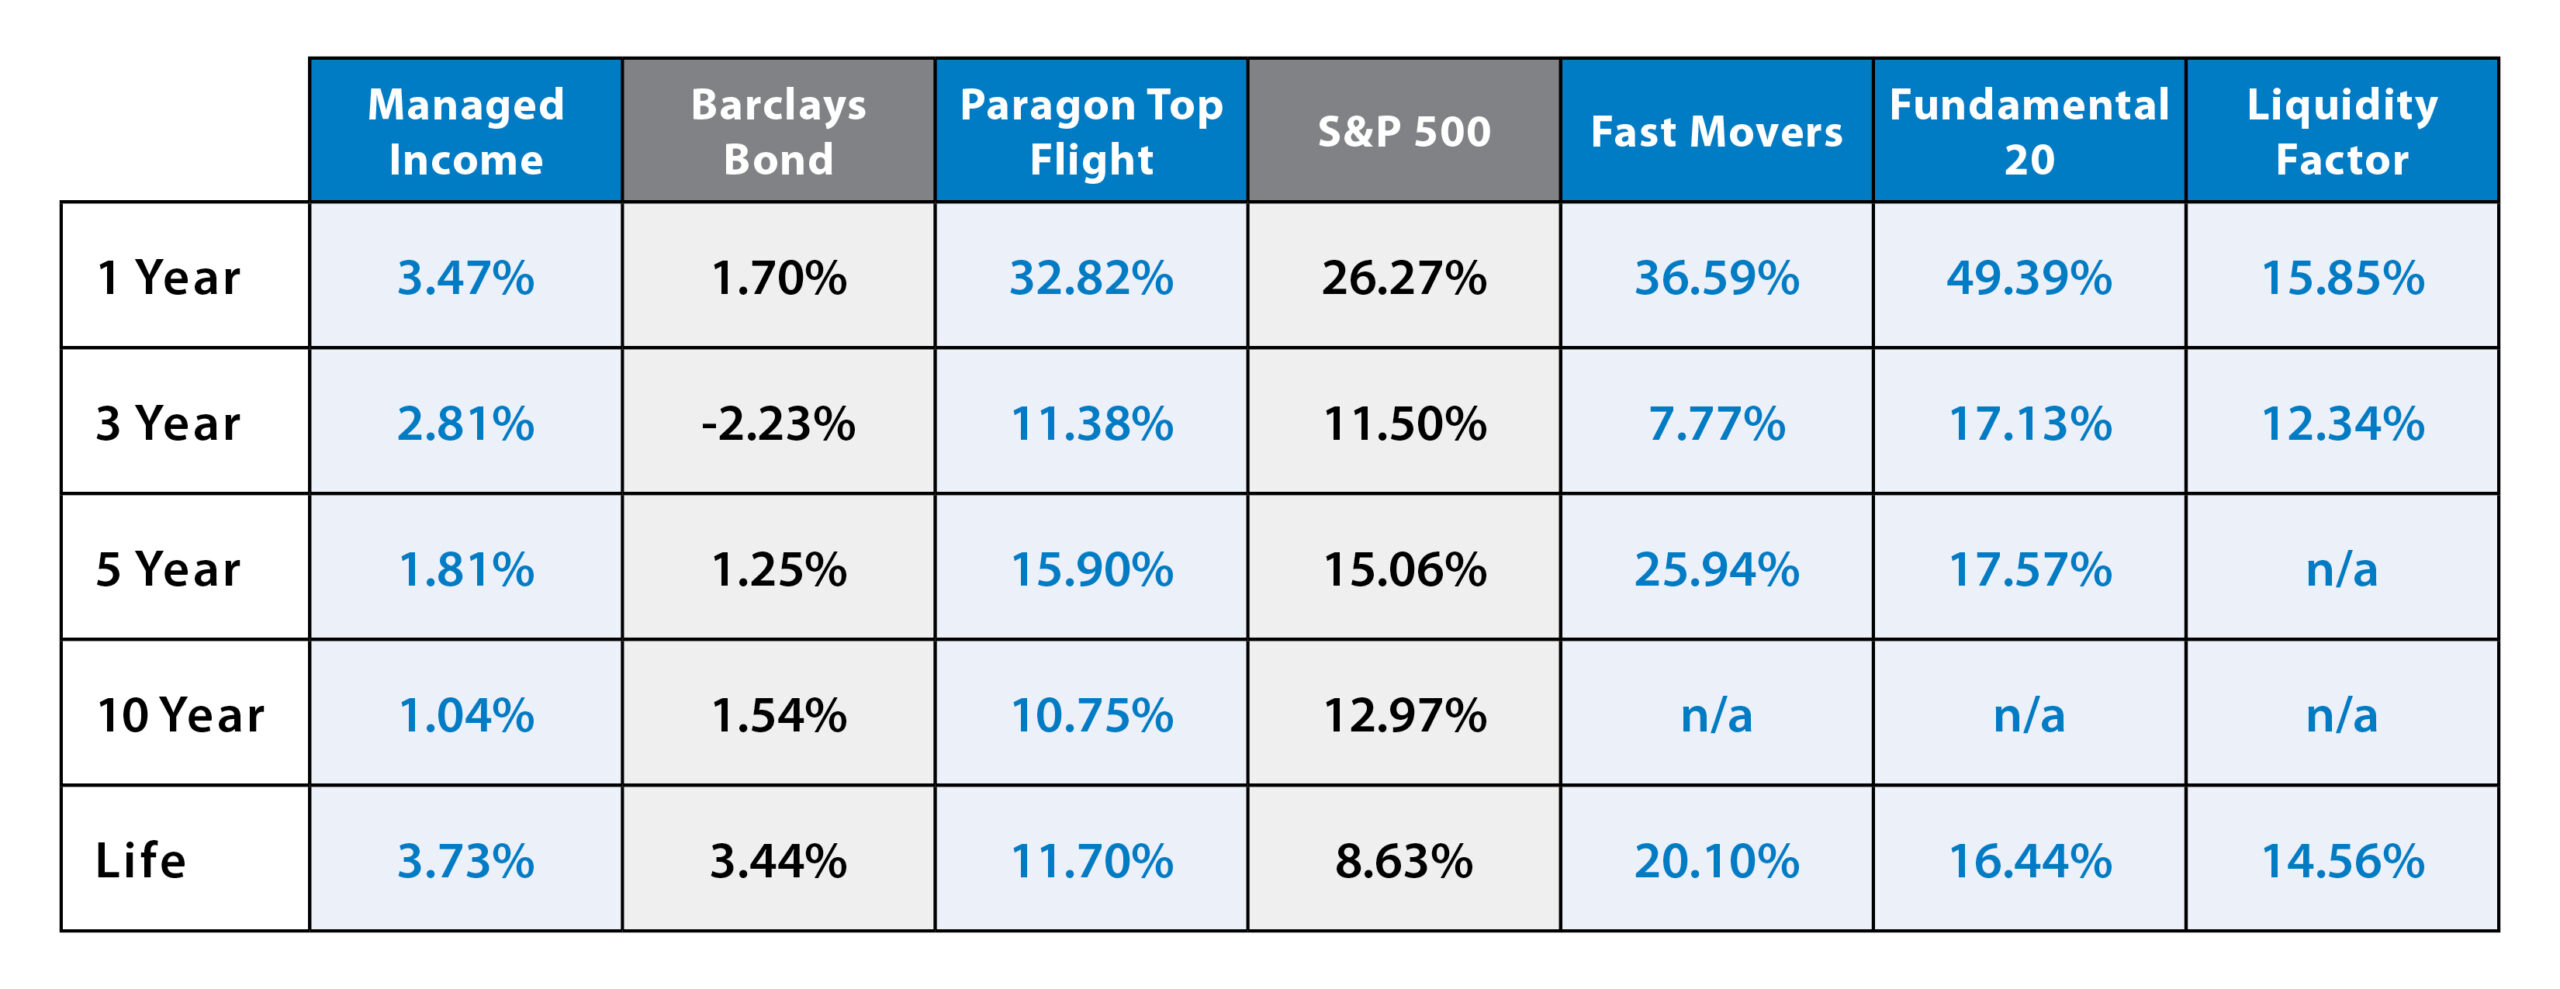
Paragon’s growth portfolio, TOP FLIGHT, generated a total return of 1,724.60% compared to 778.97% for the S&P 500 from its inception on January 1, 1998, through March 31, 2024. This translates into an annual return of 11.70%, compared to the 8.63% for the S&P 500. For example, if a person invested $100,000 in January 1998, their account would have grown to $1,826,170 net of fees versus $878,931 for the S&P 500 during the same time period.
PARAGON’S Conservative Portfolio MANAGED INCOME
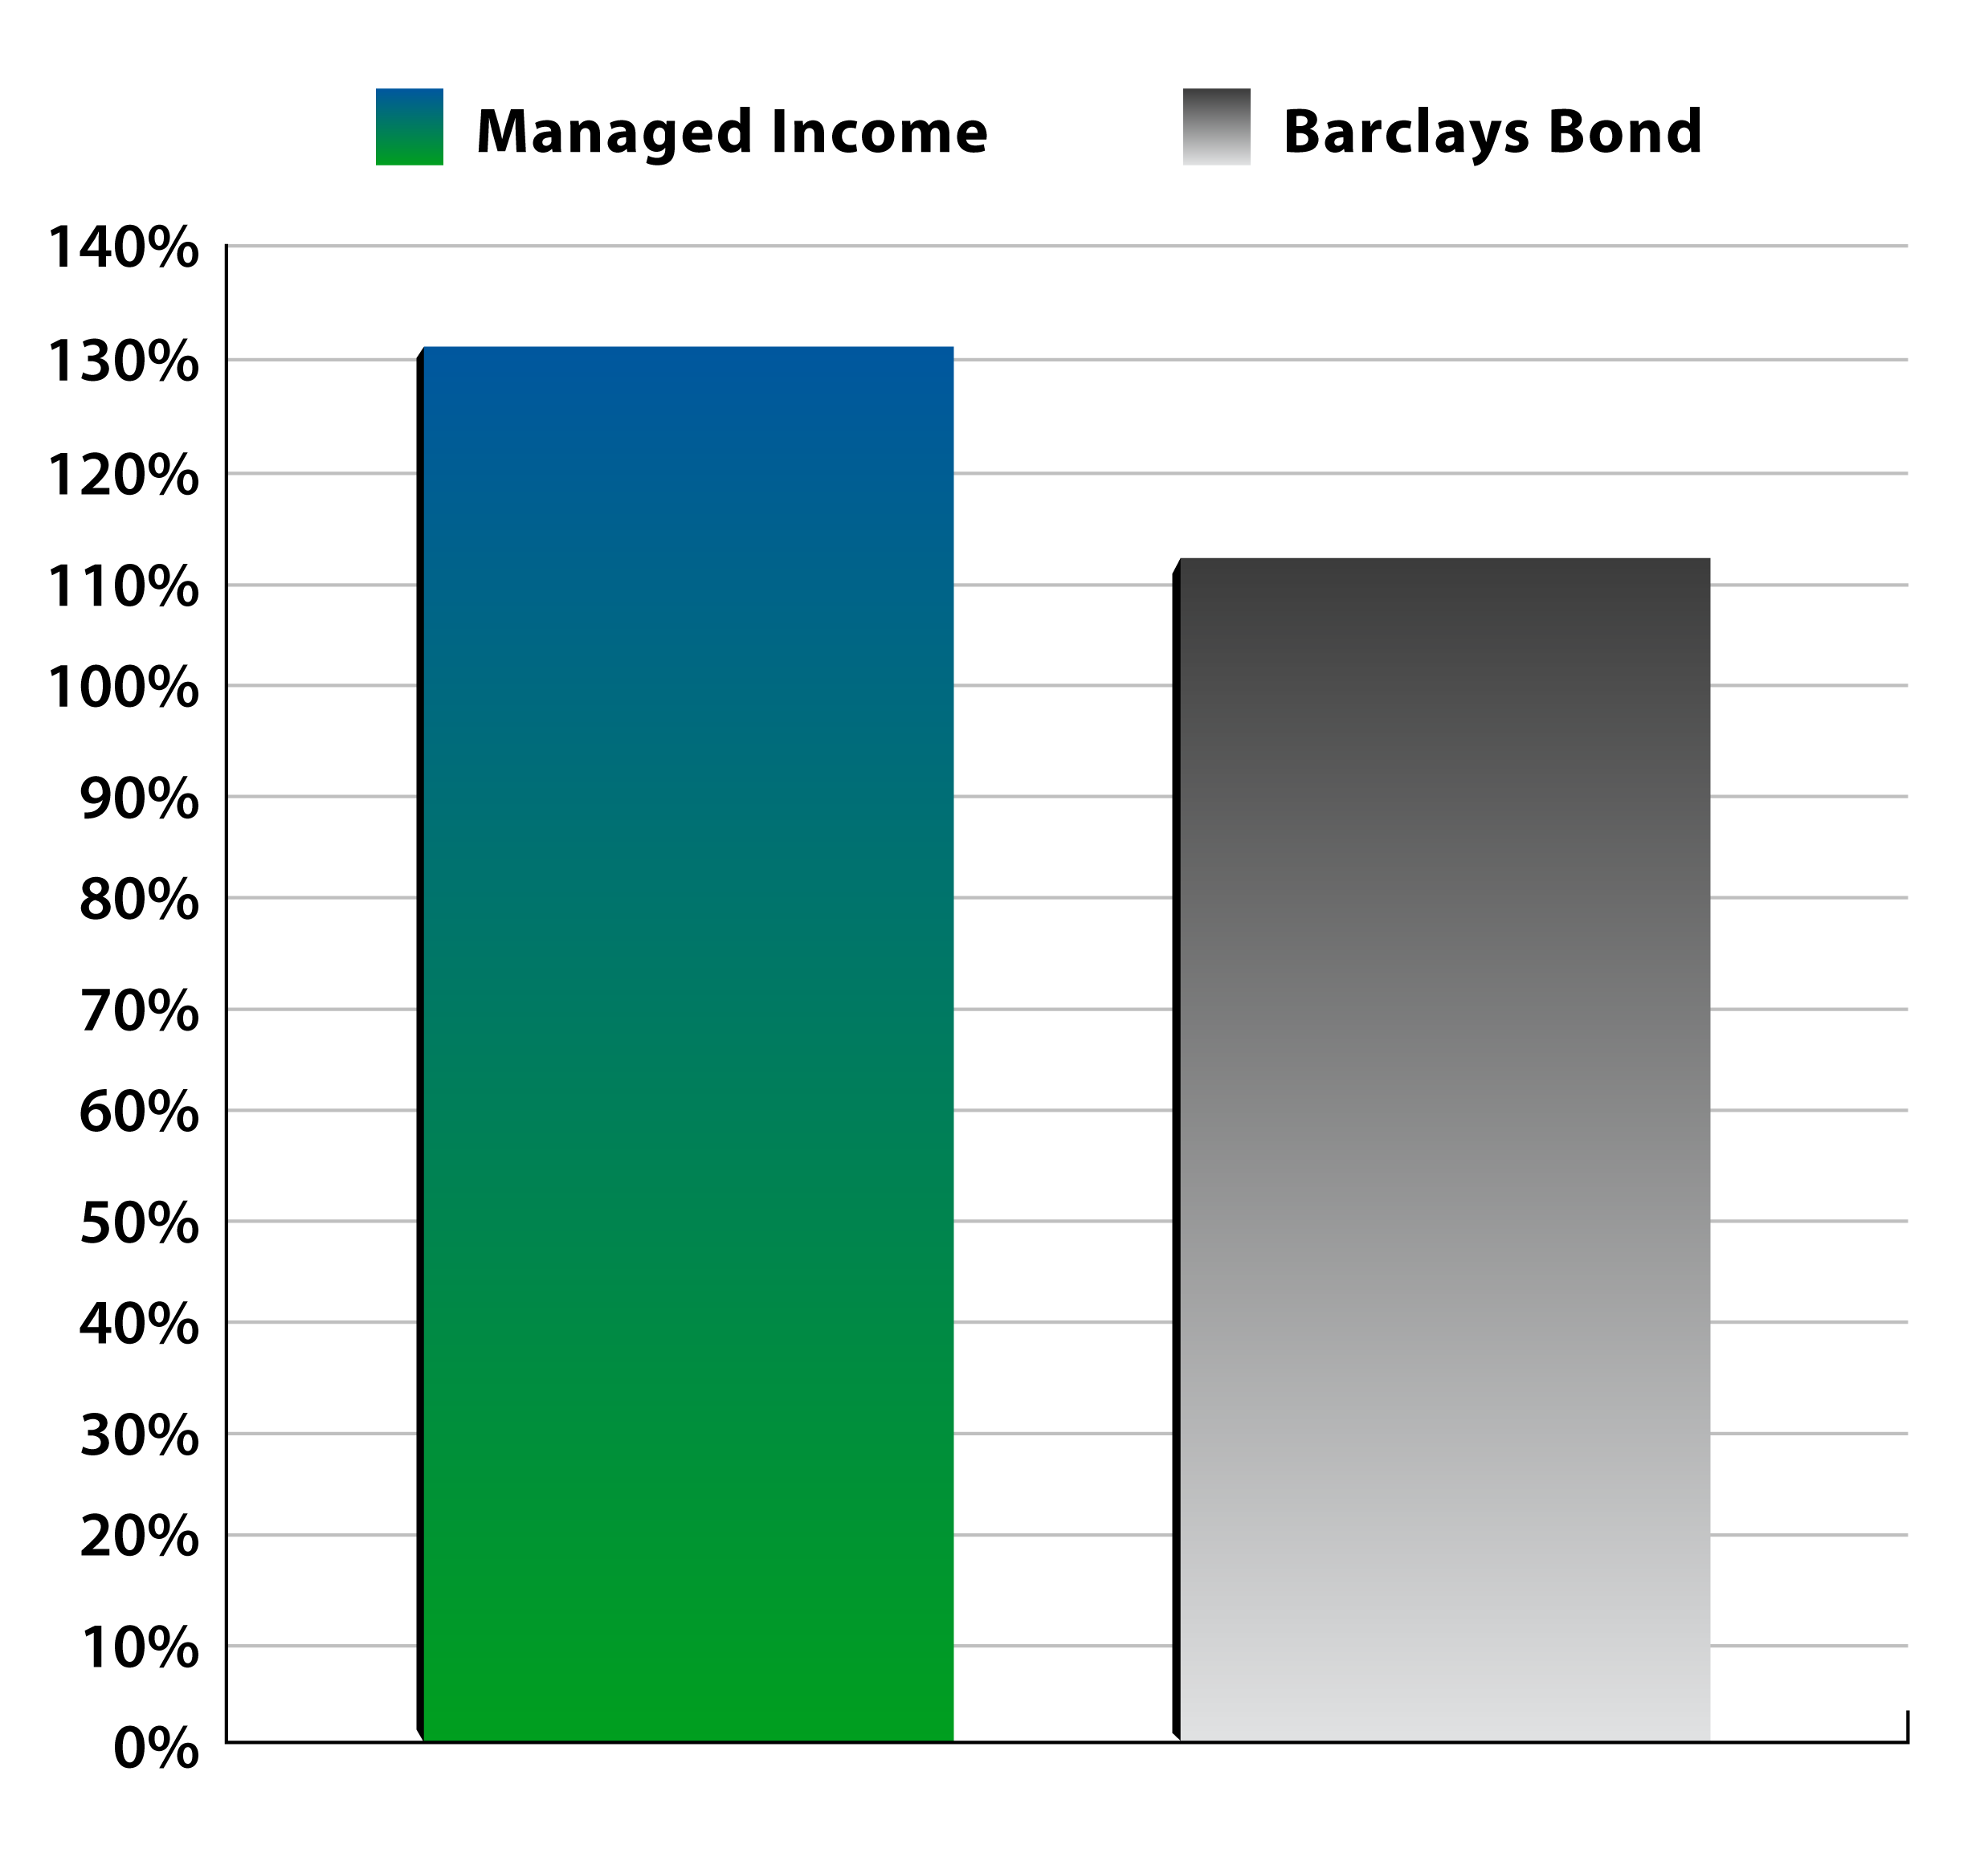
Paragon’s conservative portfolio, MANAGED INCOME, generated a total return of 131.04% compared to 112.82% for the Barclays Aggregate Bond Index from its inception in October 2001 through March 31, 2024. This translates into an annual return of 3.73%, compared to 3.41% for the Barclays Aggregate Index. For example, if a person invested $100,000 in October 2001, their account would have grown to $231,183 net of fees versus $215,852 for the Barclays Aggregate Index during the same time period.
- Investment performance reflects time-weighted, size-weighted geometric composite returns of actual client accounts and not back tested hypothetical returns or performance. Returns reflect all material market and economic conditions for the time periods specified.
- Investment returns are net of all management fees and transaction costs, and reflect the reinvestment of all dividends and distributions.
- The investment objective of the Top Flight, Fast Movers, Fundamental 20 and Liquidity Factor Models is capital appreciation and employs the use of various models to achieve this objective. The investment objective of the Managed Income portfolio is income with a secondary objective of capital appreciation and employs the use of various models to achieve these objectives. Both Paragon Top Flight, Fast Movers, Fundamental 20, Liquidity Factor and Managed Income Portfolios use various models that have changed from time to time and may change in the future and the effect on performance results could be either favorable or unfavorable.
- U.S. Stock: Russell 3000 Total Return. Global Stock Ex U.S.: MSCI ACWI Ex USA Net Total Return. U.S. Bond: Bloomberg US Aggregate. Global Bond: Bloomberg Global Aggregate. U.S. Real Estate: Dow Jones US Real Estate Index Total Return. The S&P 500 Index is a market-value weighted index comprised of 500 stocks selected for market size, liquidity, and industry group representation. The Barclays Aggregate Bond Index is a benchmark index made up of the Barclays Government/Corporate Bond Index.
- Benchmarks are used for comparative purposes only. The Paragon Top Flight, Fast Movers, Fundamental 20, and Liquidity Factor Models are not designed to track the S&P 500 Index or other referenced indices and will have results different from the benchmark. The Paragon Managed Income Portfolio is not designed to track the Barclays Aggregate Bond Index and will have different results.
- Past performance is not indicative of future results. Investments in securities involve the risk of loss.
Paragon Wealth Management is a provider of managed portfolios for individuals and institutions. Although the information included in this report has been obtained from sources Paragon believes to be reliable, we do not guarantee its accuracy. All opinions and estimates included in this report constitute the judgment as of the dates indicated and are subject to change without notice. This report is for informational purposes only and is not intended as an offer or solicitation with respect to the purchase or sale of any security. Do not rely upon this information to predict future investment performance or market conditions. This information is not a substitute for consultation with a competent financial, legal, or tax advisor and should only be used in conjunction with his/her advice. Past performance is not a guarantee of future results.
CONTACT US
Monday - Friday 9 am - 5 pm
3651 North 100 East
Suite 275
Provo, Utah 84604


