Reversal
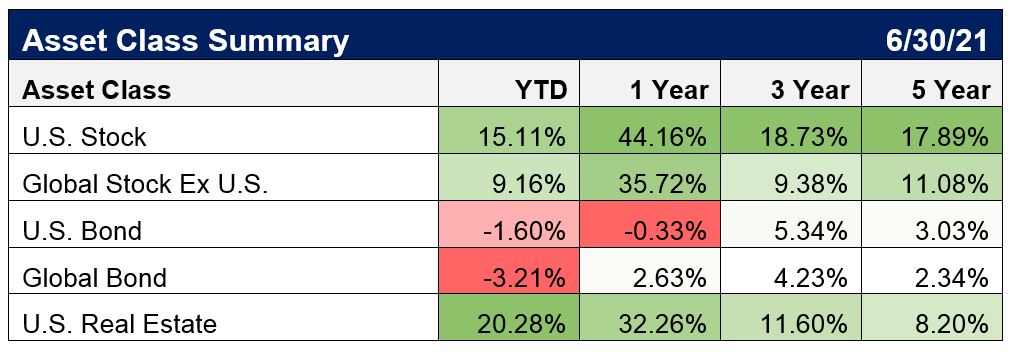
In the first quarter of 2021, we saw assets that did well in 2020 (i.e., bonds and “pandemic” stocks) start performing poorly. While areas that struggled last year (i.e., value and cyclical stocks) are now performing the best. Whether this trend continues remains to be seen. The actual effects from historic fiscal and monetary actions will take time — and they will not unfold in a uniform manner. Markets are always making an attempt to price in the benefits and costs today. While more government involvement in the economy and in capital allocation results in slower long-term growth – it can benefit publicly traded firms now because they feed at the government trough. The trillions being spent by the government and deployed by the Federal Reserve are so mind-numbingly large it is nearly impossible to comprehend. Even using the word trillions has become cavalier. In order to save us from ourselves, we are mortgaging the future. But then again, thus has it ever been. Whether future economic problems will now be inflation or back to deflation, both are two sides of the same coin — slower real growth and standards of living. How do you best protect yourself from whatever the future holds? Spend prudently, invest, and save, save, save. It will give you a margin of safety and flexibility for whatever the future brings. Financial independence comes from behavioral skills, which all of us have the ability to develop.
Model Portfolio Performance and Positioning
The first quarter of 2021 was a mixed bag due to changing dynamics within the markets. Overall? Stocks were up, bonds were down. The S&P 500 advanced over 6% for the quarter. The prospects of the pandemic ending and the economy opening up propelled economically sensitive stocks significantly higher for the quarter. To start the year, the energy, financial, industrial and material sectors were the best performing sectors. Consumer defensive sector and technology — which was far and away the best performing sector last year — were the worst performers for the quarter. While the growth-oriented names outperformed for the last year, the cyclical value areas significantly outperformed due to the positive vaccine news, the economy opening, and the prospect for significant government stimulus. The impact of this massive fiscal stimulus — and how it will be financed — is a major theme for 2021.
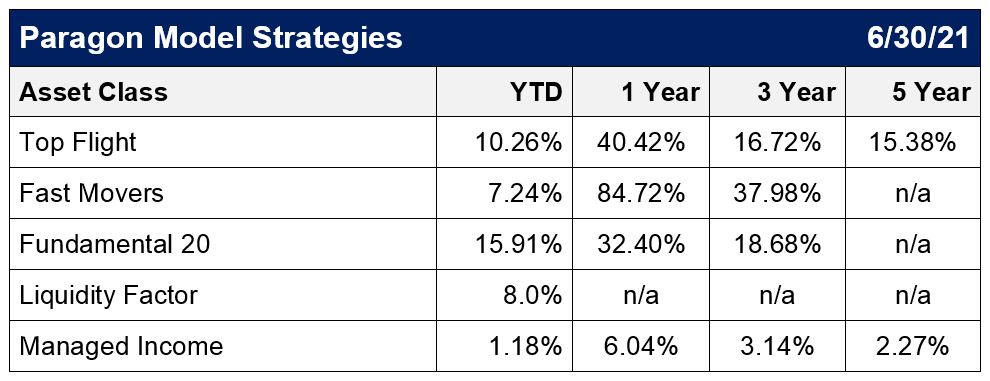
The Managed Income model was about flat for the quarter ending down 0.21%. By comparison, a widely held bond benchmark, the Bloomberg Barclays U.S. Aggregate Bond Index, was down 3.37% for the quarter — its worst quarter since 1981. Long-term Treasuries had their second worst loss ever. Rising interest rates wreaked havoc for fixed income investors. The 10-year Treasury rose from 0.90 percent to around 1.70 percent in anticipation of increasing economic growth and possible inflation. We have been wary of low yields for quite some time and have warned of the danger of chasing low yields. Prices of bonds had become so expensive that they just weren’t worth the risk of the low yields they offered. While needed, our exposure to fixed income has been flexible using a laddered approach to minimize the negative price impact of rising interest rates. We keep about a third or more of our fixed income exposure in short-term maturities so we can then rebalance into higher yields as interest rates move up. In this manner, we are not locked into today’s low yields but can progressively obtain higher yields if interest rates rise — without having to take large losses. The primary objective of Managed Income is to preserve capital on an inflation-adjusted basis with a secondary objective of income. The portfolio is very conservative by design and seeks to minimize the various risks inherent in assets classes such as volatility, credit, interest rates, and inflation. The Federal Reserve has explicitly stated their intention to keep rates at present levels through at least 2023, if not beyond. Fiscal stimulus and a rebounding economy could finally cause the long-absent specter of inflation to return. The model is one-third Treasury Bills, one-third Treasury Bonds, and currently one-third in consumer staples, emerging market, and value stocks. Each segment of the model is designed to gain exposure to an area of return, while simultaneously offsetting a different risk from the other segments. In this last quarter, for example, the stock exposure offsets the losses from the bond exposure exactly as intended. The objective is to preserve capital and get a net positive difference over time from the offsetting risks.
Among our equity and growth strategies, Fast Movers, which had an absolute banner year in 2020, finally ran into rougher waters and is down around 5% for the year. This is our most aggressive growth model and holds many technology and biotech names, which had been beneficiaries of the “pandemic economy.” It was only a matter of time before these stocks would experience a correction after a stellar run. This strategy will probably experience a rotation in holdings as many of the top performers cool off and new ones take their place. Tesla had been the top holding and best performer, but we have slowly reduced our position size. The top holding is now Chinese company Pinduoduo (Internet Retail) along with Baidu (China’s “Google”). Moderna (Biotech), one of the makers of the well-known COVID vaccine, continues to be a top holding as well. Docusign (Cloud-based software) and MercadoLibre (Latin America’s “Amazon”) were sold, and the exposure to semi-conductor sector was increased with the addition of Applied Materials, Lam Research and increased exposure to Micron Technology. The Align Technologies (makers of “Invisalign” braces) and Zoom (video conferencing) positions were reduced and Peloton (exercise equipment) exposure remained the same. While this strategy had an amazing 2020, it is important to remember that due to the volatility and position sizes within the model, we recommend exposure to be no more than a quarter to a third of one’s overall portfolio. This strategy currently has a 25% allocation within our TopFlight model.
The Fundamental 20 strategy was up about 4.8 percent for the quarter and was our best performing stock strategy. This strategy currently constitutes about 40% of our Top Flight model and follows a proprietary ranking system based upon various profitability and valuation measures of the components of the Russell 1000 Index. Normally this strategy sees little turnover of holdings throughout the year, but going into the second quarter there are significant changes in the model’s rankings. In total there are 14 new additions: Autodesk (Application Software), Autozone (Specialty Retail), Dick’s Sporting Goods (Specialty Retail), Foot Locker (Footwear & Accessories), Fortinet (Infrastructure Software), Interactive Brokers (Capital Markets), Manhattan Associates (Application Software), Moderna (Biotech), Qurate Retail (Internet Retail), Sage Therapeutics (Biotech), Synnex (IT Services), Ubiquiti (Communication Equipment), Wayfair (Internet Retail), Zoom (Telecom Services). Some of the additions are crossover holdings from other strategies, and in these cases, we may limit overall exposure in portfolios.
The ETF Relative Strength strategy was up about 10% for the quarter and was the best performing segment of the TopFlight model. Emerging Markets (EEM) and Small Caps (IWM) were the majority holdings. Both holdings remain the same going into April at about 7.5% of TopFlight, together comprising 15% of the TopFlight allocation.
The Liquidity Factor model was down about 1.6% for the quarter. This strategy seeks to take advantage of pricing anomalies in stocks that are less-liquid and/or relatively ignored by the market. The strategy is comprised of 10 stocks with 2% weightings each and currently comprises 20% of the Top Flight model allocation. Two new names were added going into the second quarter: Intuitive Surgical (Medical Instruments) and Bio-Rad Labs (Medical Devices) replacing Ulta Beauty and Autozone. Half of the strategy is now concentrated in the Healthcare sector.
*All Data in local currency and price only unless specified as total return (TR). Sources: MSCI, Barclays, Commodity Systems, Inc. (CSI, YCharts), IDC, Ned Davis Research, Inc., S&P Dow Jones Indices. See Disclosures on page X for information on performance, risks and benchmarks.


